Weekly briefing
Generated every week on the day and time you set. Revenue scoreboard, subscriber growth, winners vs losers, send cadence, and three prioritised actions for next week. Speaker notes baked in, ready to walk through with the client.
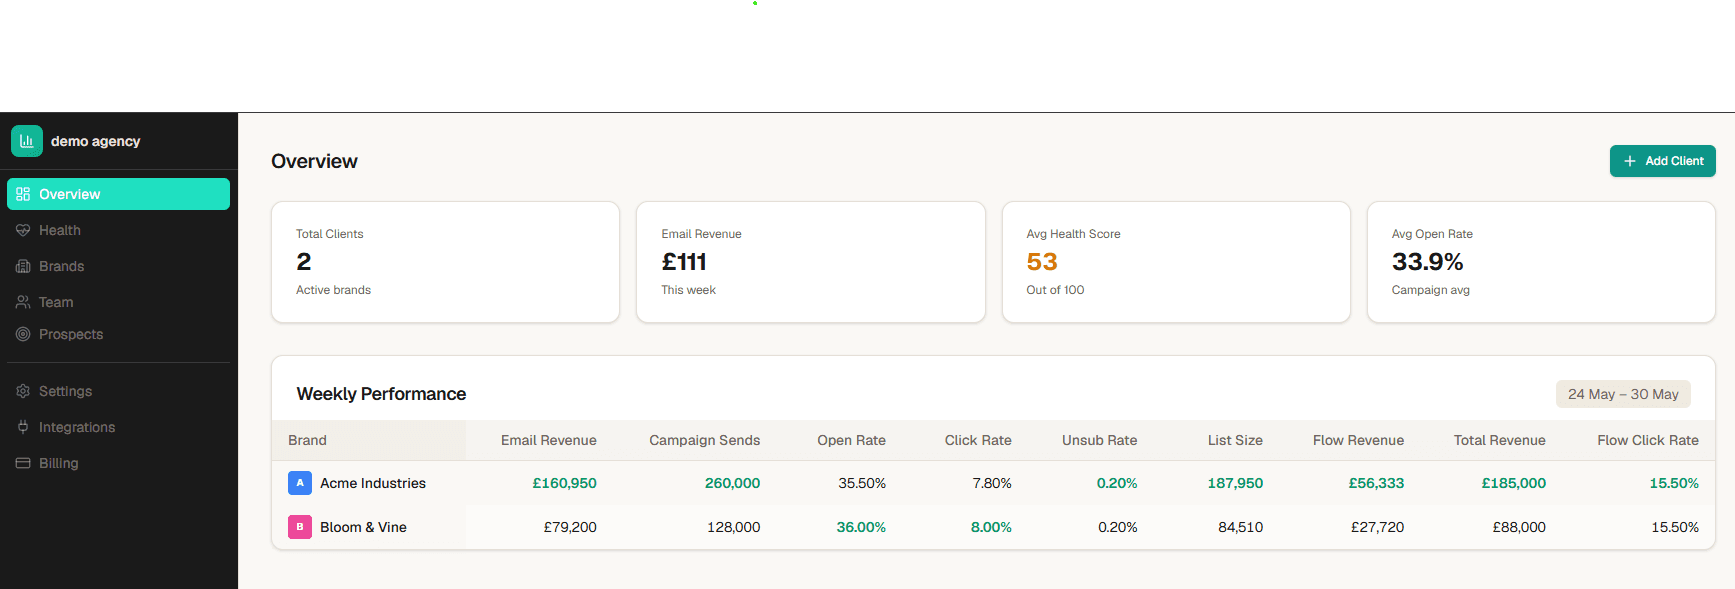
- Revenue, list health, and what to do next
- AI-written speaker notes for the meeting
- Pushed to Google Slides, fully white-labelled